Dr. David Dubbeldam
Computation Chemistry Group since 2009. Lead-author of the iRASPA and RASPA molecular simulations codes.
Visualization is a crucial tool for obtaining molecular level insight. Staring at the atomic positions in a CIF- or PDB-file for a long time will not get you closer to understanding the molecular structure. That is the job of “molecular visualizers”: to transform the data for efficient perception by the human brain. The human brain does not like tables of data, it likes graphs and plots, and from these we visually observe trends, patterns, relationships and exceptions. Therefore we developed a visualization package aimed at material science. Examples of materials are metals, metal-oxides, ceramics, biomaterials, zeolites, clays, and metal-organic frameworks (MOFs). For porous structures, like zeolites and MOFs, sometimes it is more useful to visualize the pores of the structures, rather then the atoms. That allows easy assessment of network topology, connectivity, and identification of possible bottle-necks for diffusion. A static analysis of the energy landscape inside the pores allows examination of locations of large attractive interactions with the framework, which are prime candidates for adsorption and catalytic sites. Zeolites and MOFs are usually reported with a unit cell and a space group in CIF-file format. It is very useful to be able to play around with creating supercells and symmetry operations.
The visualization projects and code iRASPA is collaboration between David Dubbeldam, Thijs Vlugt (Delft University of Technology), and Sofia Calero (Eindhoven University of Technology). It is specifically aimed at material science and the use of molecular simulations such as Molecular Dynamics and Monte Carlo. We are continuously working to improve and develop new visualization techniques for molecular simulations.
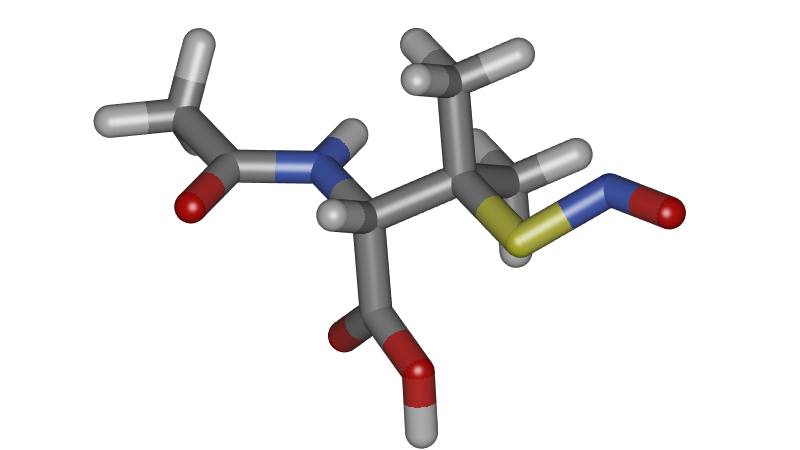
Non-periodic systems
Although our research is aimed at periodic systems, it is important to be able to visualize single molecules well. Annotation is for example very important to label the atoms types, as this is often necessary to describe classical molecular force fields.
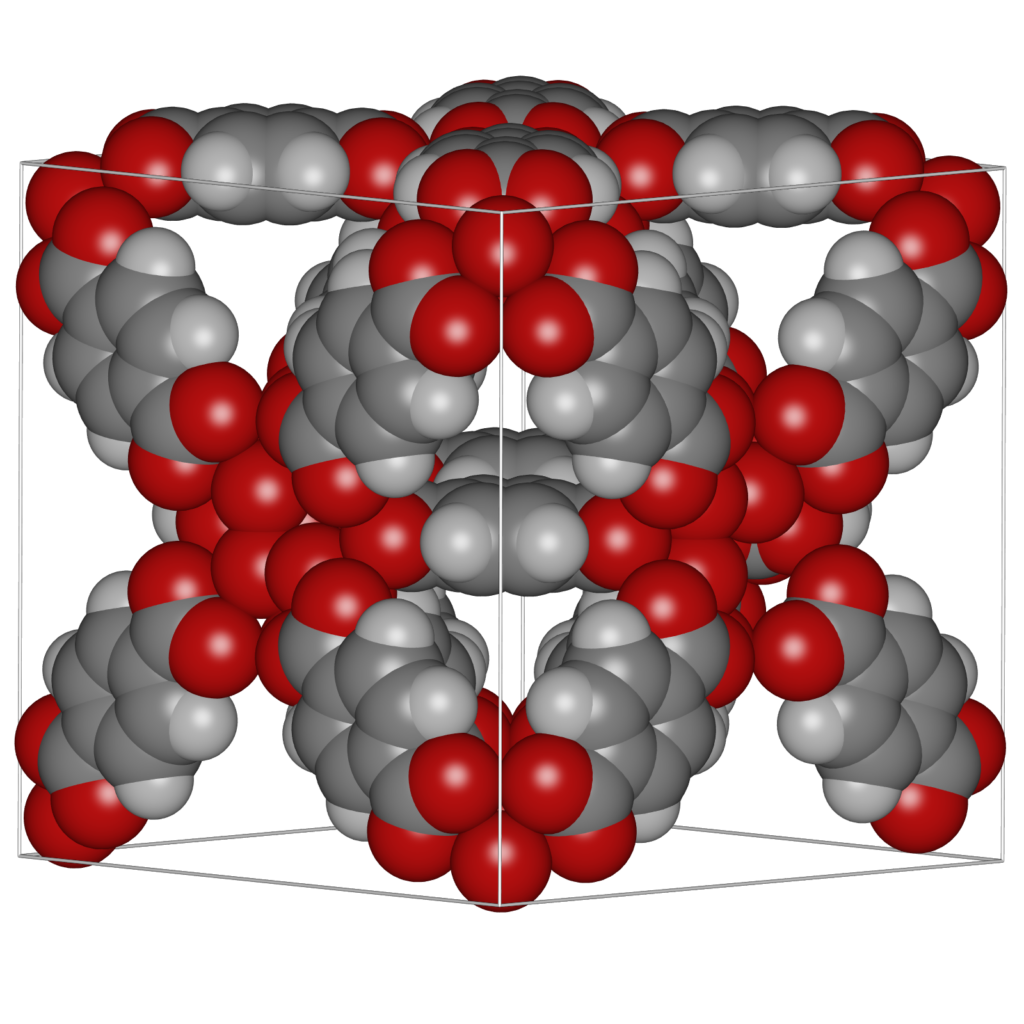
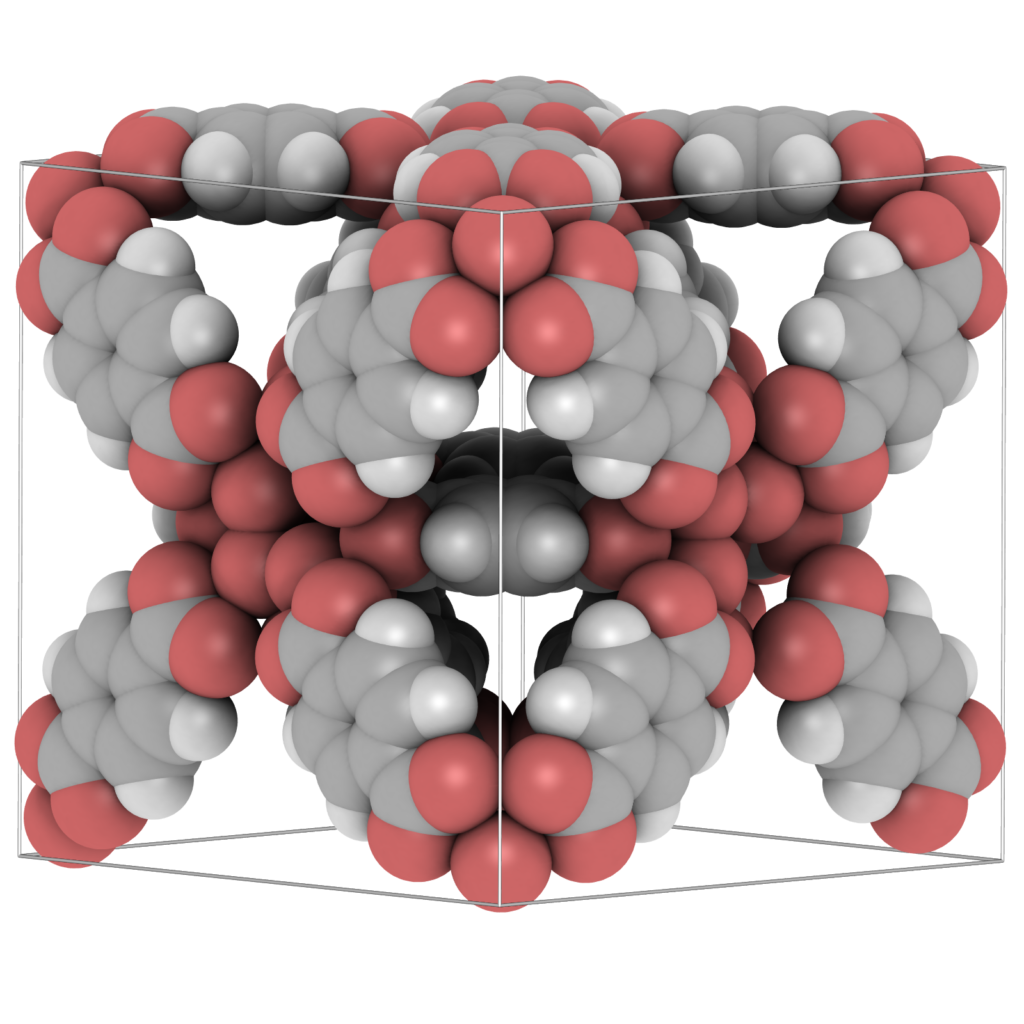
Ambient Occlusion
“Ambient occlusion” is the shadowing of ambient light. In geometric-based rendering the illumination model is local. Ambient occlusion approximates the real-life radiation of light by producing effects like contact shadows that are unattainable in the standard local lighting model. Ambient occlusion is amongst the most powerful methods to improve depth perception, i.e. it darken areas of the objects that light cannot access, therefore giving a much better perception of the 3D appearance. To give users the best experience when visualising molecular structures, ambient occlusion and shadowing methods should be included into molecular graphics packages to enhance user interaction with the structure. Advanced, yet efficient, lighting techniques including ambient occlusion, and hard and soft shadows, are key to improving the realism of the molecular visualisation.
Multiple systems
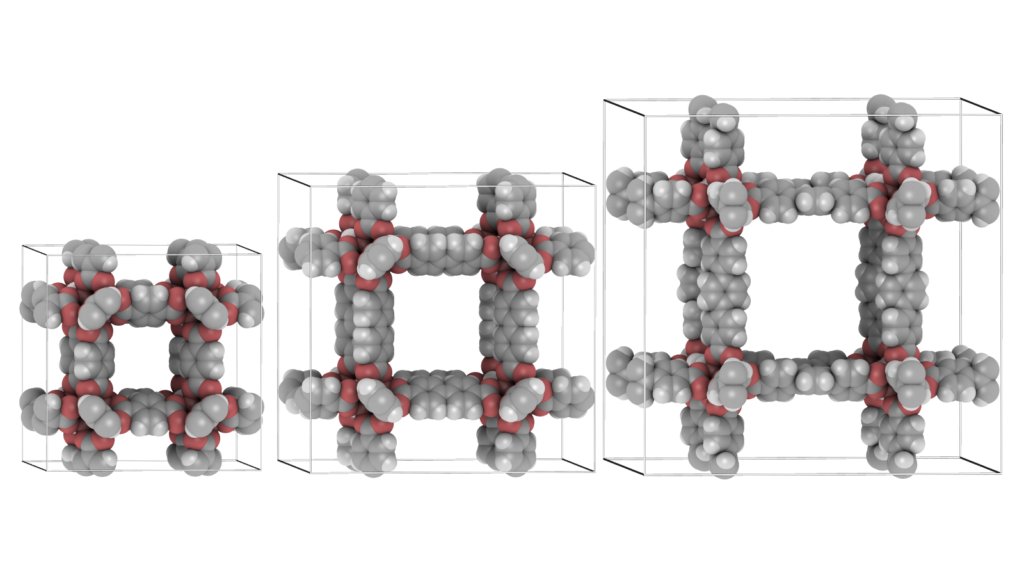
It is convenient to be able to combine multiple structures. Scenes can be a combination of movies of the different components of a system (for example: the cations, anions, and the water-solvent as three separate components as above), or they can be completely unrelated and place at any position relative to eachother. The latter can be used to make “collages”. The origin of each movie (or frame) in world-coordinates. The Figure below shows an example of placing IRMOF-1,-10, and -16 in one scene, so that their relative sizes become apparent.
Open ensembles
A system where the number of molecules varies is called an open system. Most visualization packages are limited to a fixed number of atoms. For Molecular Dynamics this assumption is usually valid, but in Monte Carlo and open ensembles it is not, for example in grand-canonical, osmotic, and Gibbs ensembles. The movie below shows a typical Gibbs ensemble set-up for a vapor-liquid equilibrium simulation of a single component CO2. The total volume is fixed, the total number of particles if fixed and the temperature is fixed, but the volume of the individual boxes and the number of atoms of the individual boxes fluctuates. The movie shows the start of such a simulation where the system quickly separates into a liquid phase (left) and a vapor phase (right).
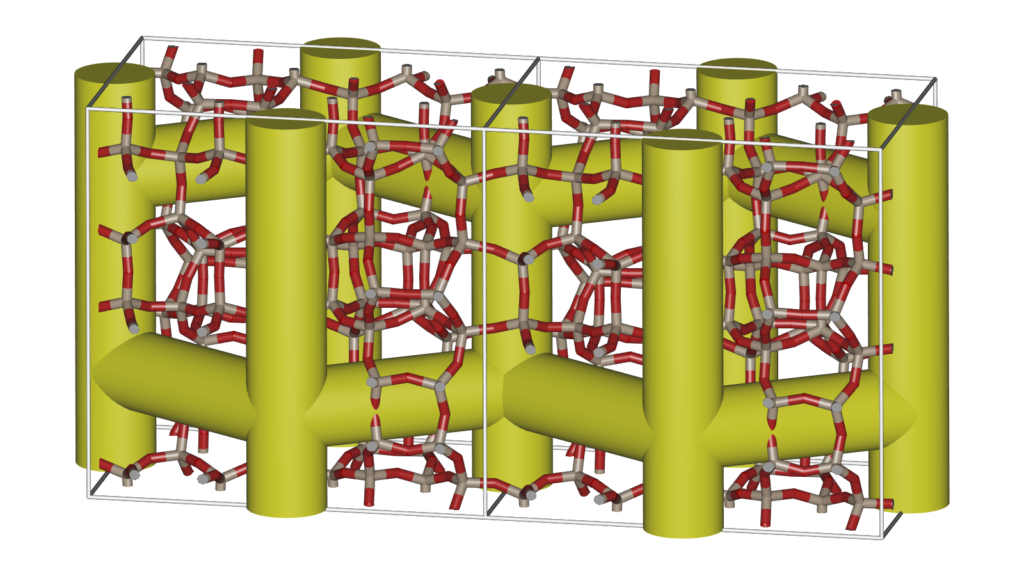
Adsorption surfaces
Examining the atomic positions of a molecular structure does not immediately lead to a thorough understanding of the structure. Molecular Shape Surfaces and Molecular Surface Maps are used as a visual summarization of a molecule’s interface with its environment. For crystalline, periodic nanoporous materials we use adsorption surfaces. Snurr et al., at the advent of computational zeolite research, already used visualization of energy contour plots and 3D density distributions of benzene in silicalite to obtain siting information. Dubbeldam et al. generated three-dimensional energy landscapes using the free energy obtained from the Widom insertion method. One would like to know the details of the topology of the structure, and using iRASPA we can interpret and classify the structure by computing adsorption surfaces. Note that this analysis also immediately reveals “pockets” that are not accessible from the main channel systems for the probe molecule.
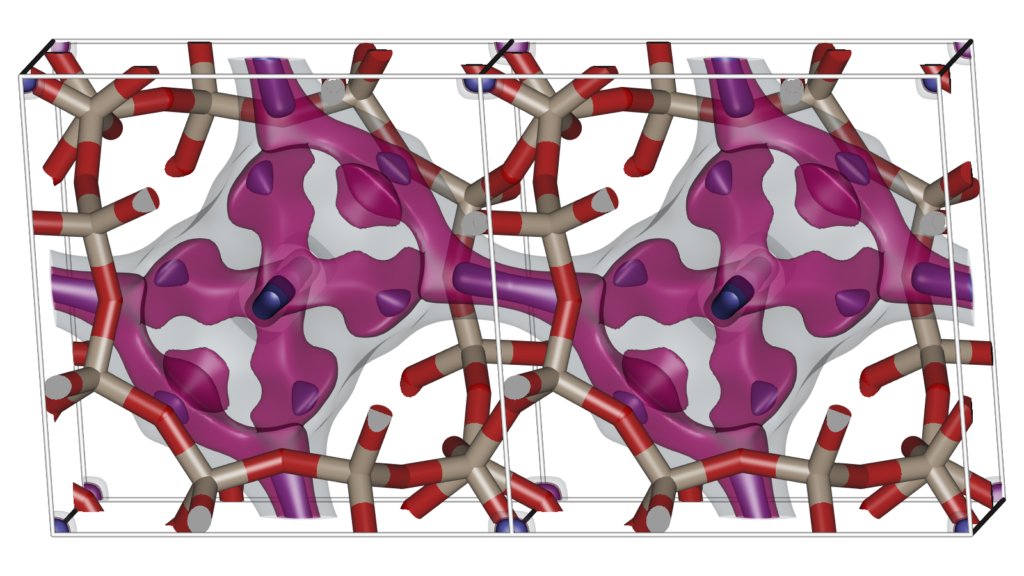
The Figure shows two unit cells of the atomic structure of the CHA-type zeolite along with three isosurfaces of helium at different energies: (1) energy zero to show the shape of the pores (transparent grey color), (2) medium low energy to show the “diffusion paths” (transparent magenta color), and (3) the lowest energy sites that correspond to adsorption sites (solid blue color). CHA has (for helium) small inaccessible pockets located at (0,0,0).
Schematics
Energy surfaces are a great way to show the actual channel shape felt by a probe atom. However, sometimes it is good to abstract the surface into a schematic that more clearly shows the channel topology.